VAG owners can use a device and program called VCDS (formally Vagcom) to see and log the ECU engine data.
If a diesel engine has lambda sensors it is able to make accurate assessments about fuelling.
Bosch Injector PD tdi engines do not have lambda sensors and so are unable to calculate the efficiency of their own fueling. This means that VCDS figures about fuelling are ECU request figures not actual outcome figures.
VCDS 17.8.1 Full+Loader V2/V4 Free Download
So a car with a worn camshaft or worn injectors could have messed up fuelling and the ECU will never know. This is why real chip tuning/remapping should be done on a rolling road with sensors measuring the Air/Fuel ratio.
Map changes without a rolling road and Air/fuel ratio measurements have to assume that the engine is in perfect, unworn condition .
The information below is mostly based on a VW 100 bhp pd tdi engine and EDC15 ecu.
Looking at maps.
The Basics.
For the engine to run it will need a Quantity of fuel (IQ) injected at at ime when adequate air is available for the fuel to burn.
This leaves the Engine ECU with a number of factors to consider.
The drivers requirement (drivers wish).
The current engine speed.
The amount of air available. (MAF and MAP)
The engine/coolant temperature.
The fuel temperature.
The intake air temperature.
To protect the engine against mechanical damage and prevent black smoke, there are limitations on the quantity of fuel injected (IQ).
The engine control unit therefore calculates a limited final value based on a number of limiting factors.
Limiting factors include:
The air mass available (MAF) via Smoke map.
The air pressure (MAP) this is via boost and boost limiter. (A MAP based smoke limiter may exist in some ECU’s).
The Absolute air pressure (Torque map)
The engine speed. (All maps)
I will start with Drivers wish.
WinOLS Video+PDF Tutorial Download
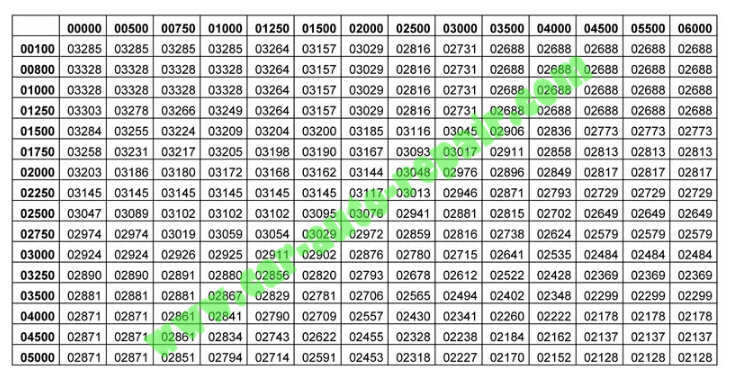
1.Drivers Wish PD 100 bhp
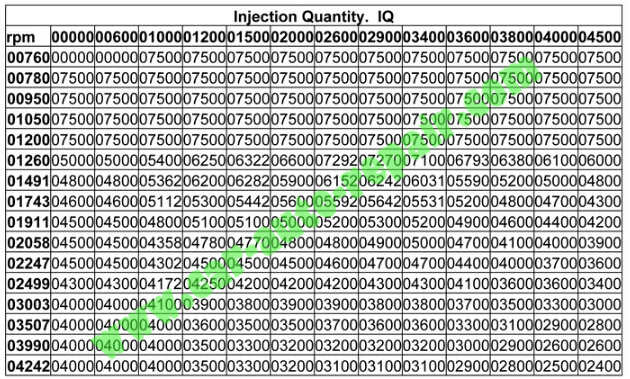
This map converts the drivers accelerator pedal pressing (%) into an Injection Quantity (lQ) of fuel.
This is raw hexdump data.
Rows are rpm, 0 to 5355.
Columns are accelerator % position, 0 to 100%
Table data is Injection Quantity, mg/stroke. 0 to 66.00mg/stroke
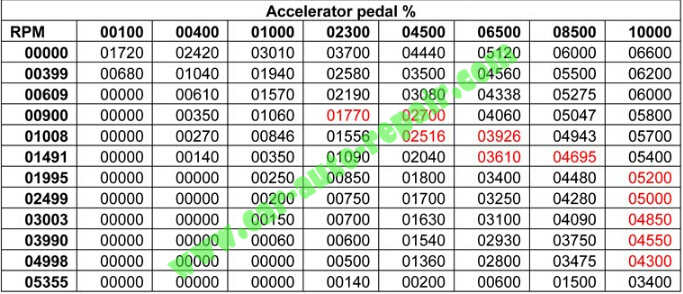
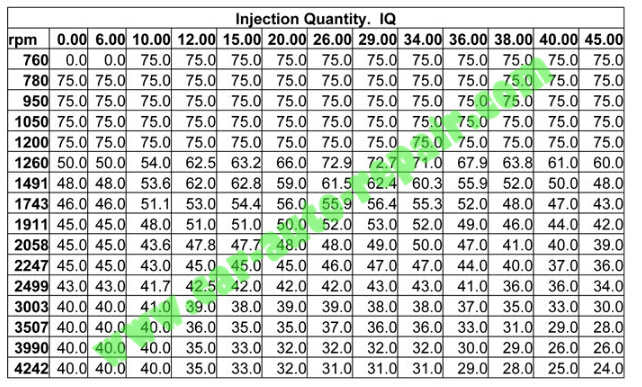
and with factors applied
900 rpm and below the drivers wish map is not functioning. Idle control is via the idle control map. The red highlighted squares show data roughly in line an accelerating engine (rpm steadily rising). At 1491 rpm the ECU is injecting 54mg of fuel. The maximum theoretical value for this engine based on available airflow is about 63mg.
An examination of the boost map will confirm that full boost is available from roughly 1500 rpm on these engines and full boost gives maximum available airflow so 1491 rpm for 54mg IQ makes Sense-.
As engine rpm continue to rise, the amount of IQ needed for the increased rpm starts to fall from 54mg to 52mg to 48.5mg etc.
This might seem odd but only if you are thinking of acceleration .
Once you reach the required engine rpm and speed, you don’t want to continue accelerating. That would be a waste of fuel.
The ECU is doing what you do naturally when you drive at constant speed. It is finding the least amount of fuel needed to keep that speed.
This drivers wish shows that with the right gearing it should be possible to maintain 5355 rpm using only 34mg of fuel per stroke.
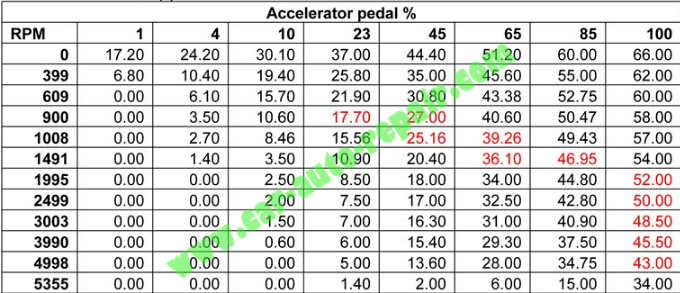
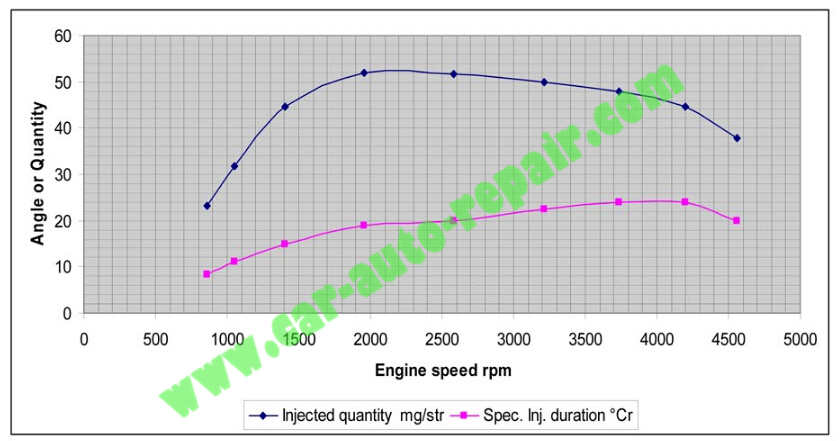
Below is the same information recorded from the ECU using VCDS.
This is a graph showing injection quantity (IQ) varying with engine speed (rpm)
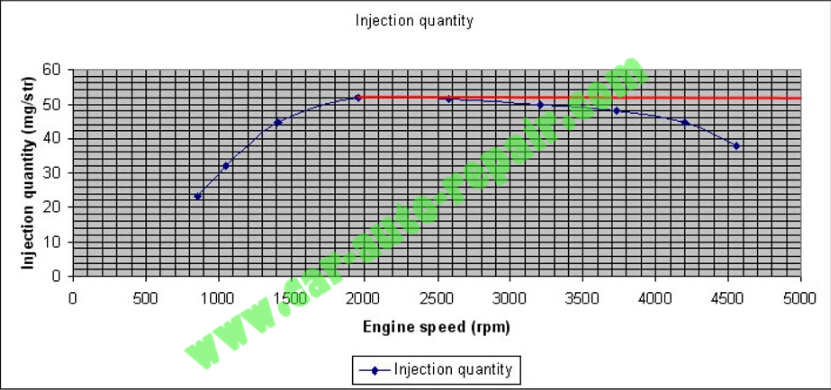
From the graph you can see that;
850 rpm is using an IQ of 23mg of fuel.
1050 rpm is using an IQ of 32mg.
1400 rpm is using an IQ of 44mg.
2000 rpm is using an IQ of 52mg.
2600 rpm is using an IQ of 52mg. On this example the maximum IQ is 52mg. 3200 rpm is using an IQ of 50mg.
3750 rpm is using an IQ of 49mg.
4200 rpm is using an IQ of 45mg.
4550 rpm is using an IQ of 38mg.
As on the drivers wish map, the IQ value maximum of 52mg at 2000 rpm steadily falls as the rpm continue to rise.
On this example 4550 rpm is using 38mg/stroke.
The ECU has a number of inbuilt limiting factors preventing drivers wish being converted directly into Injection Quantity.
So although the drivers wish may have a realistic 100% peak request of 60mg/stroke, it will not happen because of limiting factors.
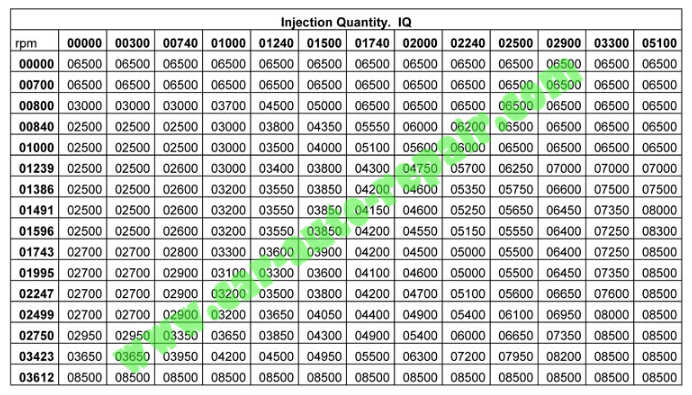
2.Smoke map IQ limit by MAF
The smoke map limits the Injection Quantity according to the amount of air available for the burning of the fuel.
This is raw hexdump data. Rows are rpm, 0 to 5355.
Columns are Mass Air Flow in mg/stroke (300 – 1000mg/stroke) Table data is Injection Quantity, mg/stroke.
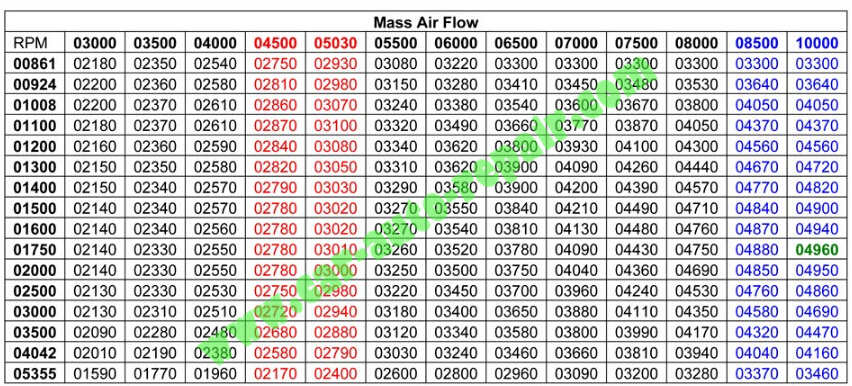
and with factors applied
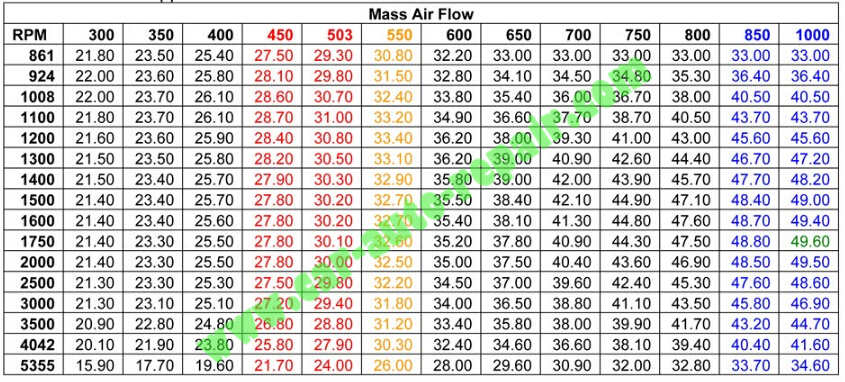
The basic MAF value without any turbocharger assistance is 474mg/stoke. The two columns highlighted in RED are roughly this value. (450-503 mg/stroke).
Full boost value (about 2000mbar) will give a MAF value of 948 mg/stroke (2 x 474). The two columns highlighted in BLUE are roughly this value. (850-1000 mg/stroke).
For any given rpm and MAF value there is a calculation for IQ preventing too much fuel being injected for that MAF value.
The maximum IQ that this map is allowing is 49.6 mg/stroke.
So the drivers wish map may have a top request of 60 mg/stroke but in real life it probably tops out at 54mg/stroke.
The smoke map is limiting this 54mg/stroke to 49.6 mg/stroke.
The smoke map only allows a specific IQ request if enough air is available for that amount of fuel to burn correctly.
In diesel engines the MAF value must exceed the required figure by 10 – 20% to ensure no smoke. This gives a Lambda reading of 1.1 – 1.2 which can be confusing if you are used to the expected lambda of 1.0 on a petrol engine.
The column highlighted in Orange shows the default MAF value of 550 mg/stroke that many ECU’s use if the MAF sensor fails.
Below is the MAF information recorded from the ECU using VCDS.
This is a graph showing Mass Air Flow (MAF) varying with engine speed (rpm)
This is what the engine is actually doing (vcds log)
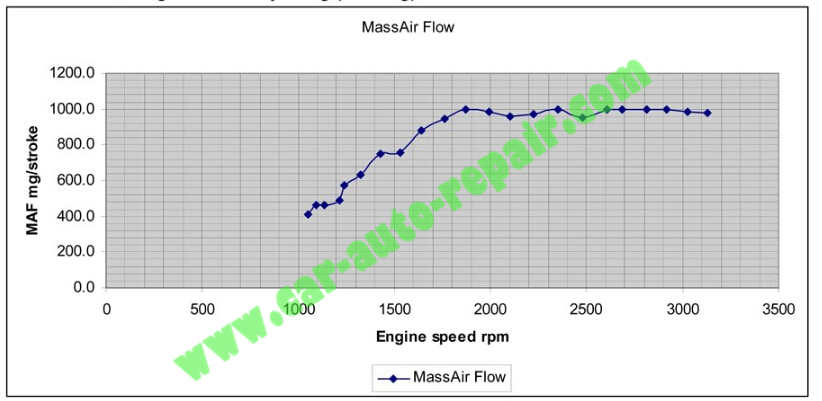
The MAF value rises steeply from about 1050- 1850 rpm due to the fact that the turbo vanes are positioned for maximum boost.
Peak airflow is available at about 1850 rpm on this graph but 800 mg/stroke is good enough for higher IQ requests so the engine is “on song’ from about 1500 rpm. From now on, as the engine rpm rise the boost will stay steady at this value so the MAF value will stay steady at this value too. This is made possible by the turbocharger vanes closing as engine rpm rise. If the vanes did not start to close, boost would continue to rise with engine rpm and ‘over boost would occur. On a traditional turbocharger set up the waste gate or dump valve would reduce boost rather than the turbo van solution used on vnt turbochargers in VAG diesel engines.
With maximum boost of 1950 mbar you would expect peak MAF to be about 925 mg/stroke (1.95 x 474) which it roughly is on the graph above.
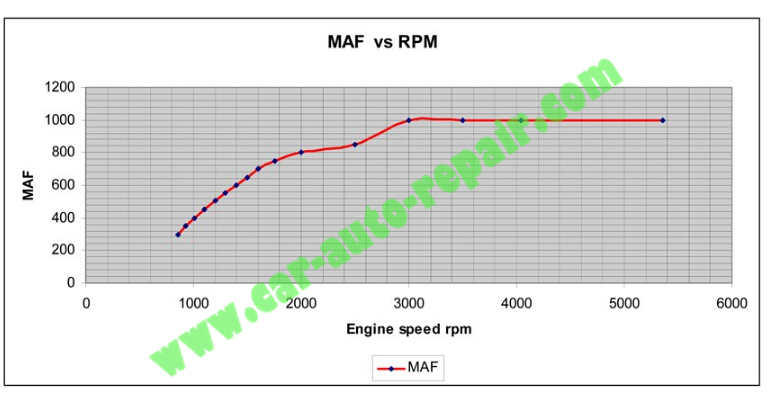
This is the same graph showing MAF specified values. (This is what you want the engine to do. ECU data)
Bosch Motronic 1.7 ECU Remap/Flashing Guide (WinOLS)
3.Torque limiter
This is raw hexdump data.
Rows are Atmospheric air pressure in mbar. 800 – 1000mbar
Columns rpm, 0 to 5355 rpm
Table data is Injection Quantity, mg/stroke.
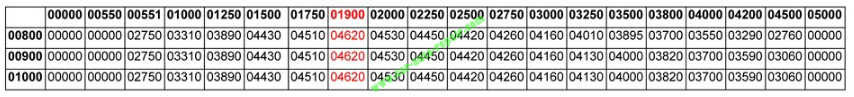
and with factors applied
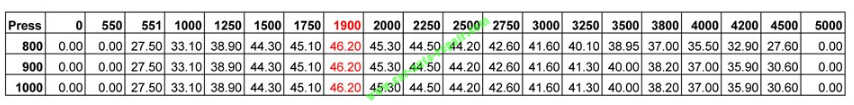
Looking at the torque map you can see that 1900 rpm is the point of maximum IQ at any atmospheric air pressure.
The torque limiter is limiting the IQ. The smoke map may have allowed a maximum IQ of 49.6 but the torque limiter is only allowing a maximum IQ of 46.2 mg/stroke
The torque limit map helps to protect the turbocharger when atmospheric air pressure is low (below 1000 mbar) and protects the engine drive train (clutch, gearbox etc) from excessive torque at the wrong time. (Although some people like wheel spin)
4.Boost
Without boost the maximum IQ for our 474 cms cylinder would be about 32mg/stroke. The boost map allows the turbocharger to increase the amount of air and therefore allow an increase in 1Q. This is raw hexdump data.
Rows are engine speed. 0 – 4494 rpm. Columns are IlQ. 0 – 45 mg/stroke. Table data is Boost. 0 – 1950 mbar.
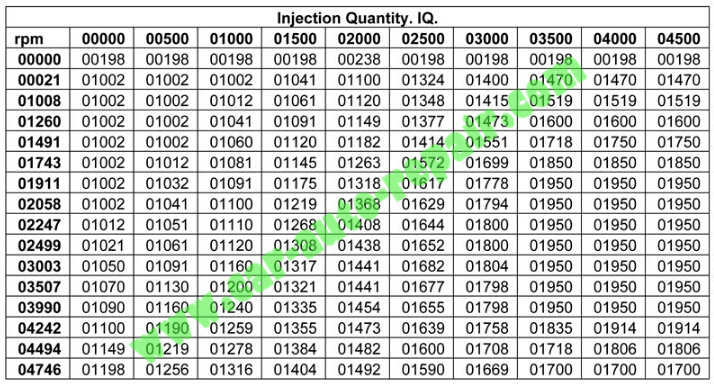
and with factors applied.
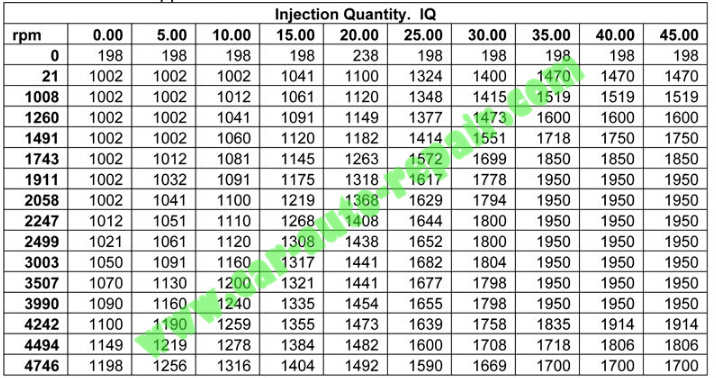
Maximum boost available from the boost map is 1950 mbar. If we assume our 474 cms Cylinder holds 474 mg of air at normal atmospheric pressure (1000 mbar), it will hold 924.3 mg of air at 1950 mbar. (1.950 x 474).
With an airfuel ratio of 14.6 : 1, 924.3 mg of air can correctly burn 63.3 mg of fuel (924.3/14.6). The boost of 1950 mbar gives plenty of air for the highest IQ on this map which is 45.0 mg.
More boost does not mean more power. More boost with more IQ means more power. The IQ and Boost must match.
Notice that for the higher IQ level the boost reduces slightly at the highest engine speeds. The boost is being limited.
Don’t forget. You can’t ask for more Boost than the turbocharger can actually produce. Below is the same information recorded from the ECU using VCDS.
This is a graph showing Specified intake pressure (blue line) and Actual intake pressure (pink line) varying with engine Speed (rpm)
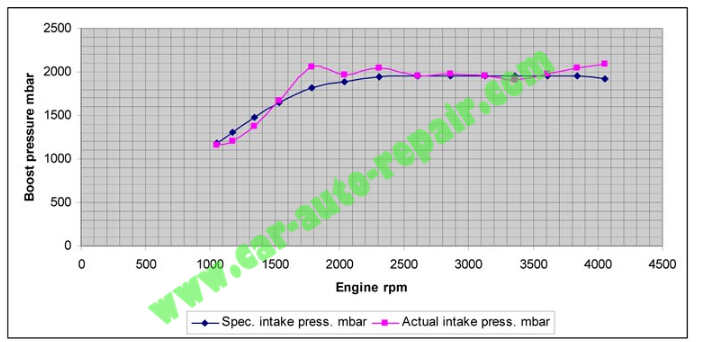
The blue line is a direct representation of the boost map data,The pink line is boost pressure as
measured by the Manifold Absolute Pressure (MAP) sensor. lt is the shape of the blue line that would be changed if the ECU boost map were altered.
Don’t forget.Everyone talks about ‘more boost but what fuel needs is more Air to burn so what we actually want is more MAF and the way to get more MAF is to increase boost.
5.Boost limiter
Boost needs limiting for a couple of reasons. Too much boost will provide too much air for the amount of IQ that is available.
This could make the engine run too lean and cause problems.
Boost also needs limiting when atmospheric pressure drops. At lower atmospheric pressure the air is thinner and the turbocharger may spin too fast and break.
This is raw hexdump data.
Rows are Atmospheric Air pressure. 626 – 1100 mbar.
Columns are engine speed. 0 – 4494 rpm.
Table data is Boost. 0 – 2050 mbar.
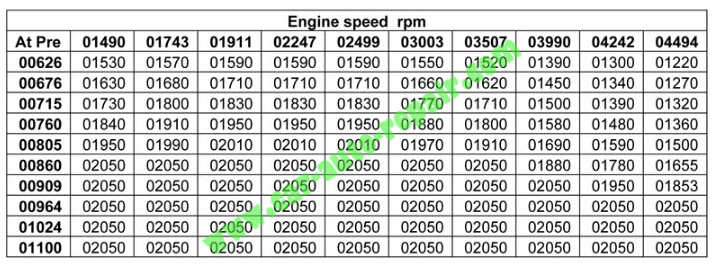
and with factors applied.
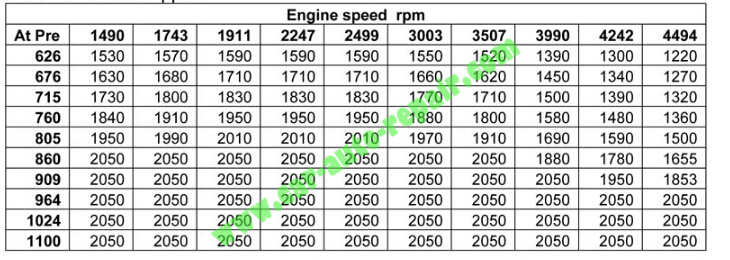
A car operating near sea level will probably only experience atmospheric air pressure in the range
964 – 1100 because ordinary weather patterns don’t cause extreme changes in atmospheric air pressure.
This means that the boost will be limited to 2050 mbar which provides for.
So under normal circumstances there will be no limiting of boost by the boost limiter.
Driving up a small mountain will cause the atmospheric pressure to drop. At an atmospheric pressure of 909 mbar the turbo charger still gives full boost up to 3990 rpm. At 4242 boost is limited to 1950 which is still full boost on the boost map.
So only at 4494 rpm is the boost being limited to 1853 mbar.
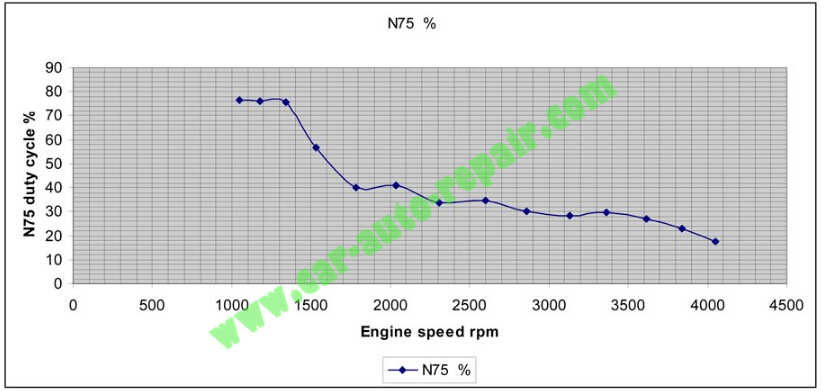
6.Boost control…N75 Duty cycle
The function of the N75 map is to convert the boost map information into electrical signals that control the N75 valve.
The N75 valve is sometimes described as a vacuum waste gate.
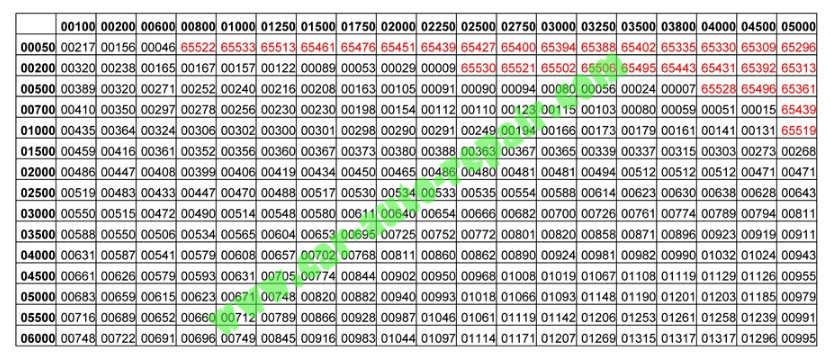
This is raw hexdump data.
Rows are Engine speed. 760 – 4240 rpm.
Columns are IlQ. 0 -45 mg/stroke.
Table data is Percent opening of N75 valve. 24% – 75%
Warning:The N75 figures show percentage opening falling from roughly 80% to 20% as the rpm rise. Earlier ECU’s were based on MAP sensor input and so the figures are reversed and run from 20% to 80%.
The meaning is the same so 80% on an early ECU is equivalent to 20% on this one.
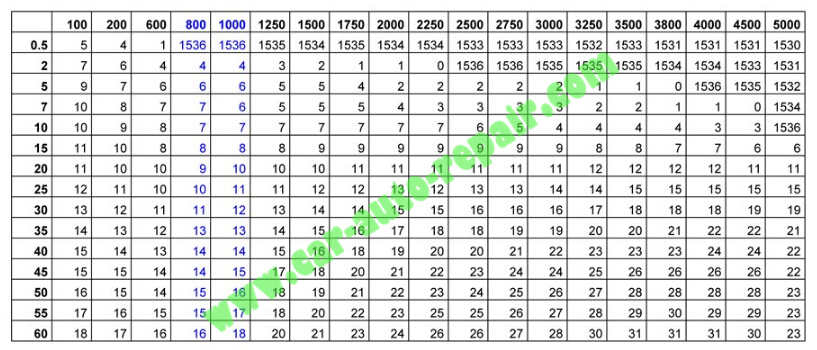
and with factors applied.
lt is important to notice that the N75 valve is 75% open as soon as the engine starts, even at idle. (look at the first few rows).
Below is an N75% VCDS readout showing how the N75 is being controlled.
A brief explanation of the N75 valve function might help. When the engine starts the N75 map requests 75% opening .
75% opening is enough vacuum for the turbocharger actuator to fully actuate, The turbocharger
vanes are positioned for maximum boost. This allows boost to rise quickly.
This might sound good but the ECU wants to maintain maximum boost, not an ever increasing amount of boost.
To prevent boost becoming too high the ECU uses the N75 map to steadily REDUCE its opening and so reduce vacuum to the turbocharger actuator. So as the rpm rise the N75% falls steadily to a
minimum opening of 24% at 4242 rpm. At this point vacuum to the turbocharger actuator is much less and the turbocharger vanes are configured to give less boost.
When the N75 reduces its opening and reduces vacuum it ‘dumps’ vacuum to the air filter. (lets air in).
The N75 map is matched to the turbocharger and so does not need changing unless it seems to be closing a little too early for the required boost. If this is the case, only tiny changes are needed.
Below is the same information recorded from the ECU using VCDS as boost.
This is a graph showing Specified intake pressure (blue line) and Actual intake pressure (pink line) varying with engine speed (rpm)
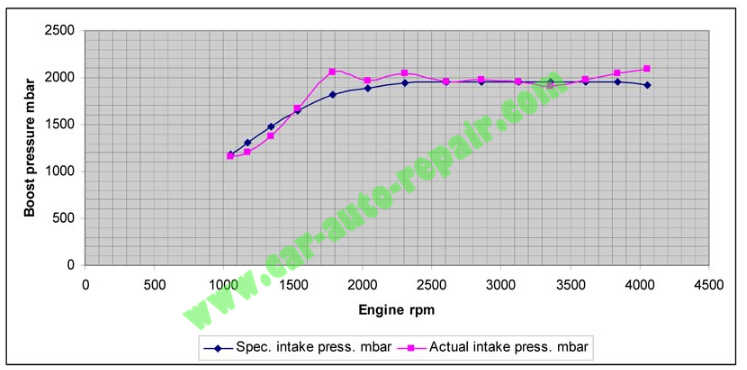
The blue line represents the Boost map data. The pink line is the N75 and turbocharger trying to replicate the boost map data in real life. So if the boost map were changed slightly to give a little
more boost, the N75 map might need tweaking a little to keep actual boost (pink line) in line with
Specified boost.
Diesel Engine Control ECU Maps Analysis
Back to Fuel injection Quantity.
IQ is made up of two parts. Duration and Start Of Injection. (SOI).
Fuel injection is very complicated these days, so this is a very simple explanation .
Imagine a fuel injector is like a doctors syringe loaded with 100 mg of fuel.
The driver presses the accelerator pedal and WISHES for 30 %. The ecu consults the DRIVERS WISH MAP and decides to inject 16 mg of fuel. SIMPLE.
BUT
When do you inject the fuel and how long will the injection take?
Engine designers measure time in degrees of rotation of the crankshaft. That is why you hear people referring to engine timing.
The ideal point to inject the fuel is generally taken as Top Dead Center.(TDC). This is the point when both valves are usually shut and the air has been squashed to its maximum.
TDC is often referred to as Degrees Before Top Dead Center (BTDC) or Degrees After Top Dead Center. They are both the same thing, just opposites of each other.
So 4″BTDC is the same as -4″ ATDC. (Only BTDC is used here)
Injecting 16 mg of fuel will take time (DURATION) and because the piston is going up and down, you need a START OF INJECTION point.
Lets assume 2 mg of fuel takes 1 degree of crankshaft rotation (“CR) to inject.
Assuming that the injection best time is 0″BTDC and 16mg will take 8″CR to inject. (DURATION) Injection will need to start at 8″BTDC instead of at 0″BTDC.
Start of Injection (SOI) has to be 8 degrees BTDC so that all the fuel has been injected by 0″BTDC.
So the ecu needs maps to decide on)
INJECTION QUANTITY as requested by the accelerator position .
INJECTION DURATION as calculated from the injection quantity
INJECTION START (SOI) as calculated from the duration .
Assuming that the engine is in perfect condition, the maps for Injection Quantity, Injection Duration and Start of Injection will be accurate.
So a precise amount of fuel will be injected for the correct amount of time (DURATION), starting exactly on time.(Start Of Injection)
The ecu can be sure of this because the crankshaft and camshatft sensors give precise details of the piston and valve positions and the injectors give an electrical signal (bip) to show exactly when Injection starts..
WinOLS Remap Exhaust Gas Recirculation (EGR) Map in The ECU
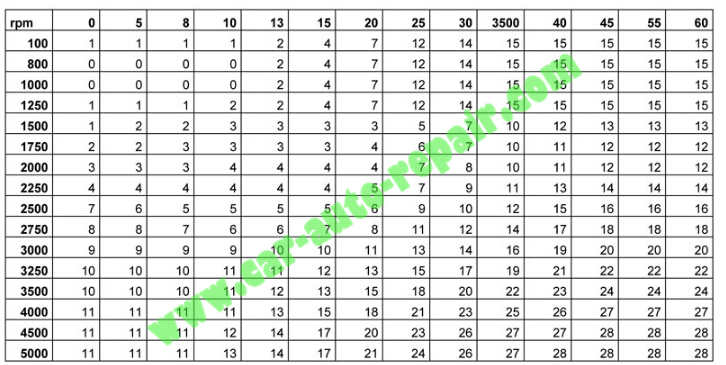
7.Duration
This is made up of six duration maps with a selector map used to selected the correct duration map for the current engine speed/crankshaft angle. The duration maps are numbered 0, 1, 2, 3, 4, & 5 on the selector map.
Maps0and 5 are 10 x 10 maps. Maps 1,2,3and4are 15 x 19 maps.
Duration 1. This is raw hexdump data.
Rows are IlQ. 0 – 60 mg/stroke.
Columns are Engine speed. 100 – 5000 rpm.
Table data is Crankshaft angle degrees.(°Cr)
As raw data for crankshaft angle is impossible to interpret | have included a chart with factors added.
Idle speed is likely to be in the area 800 -1000 rpm as shown highlighted in Blue.
The VCDS derived graph below shows an idle speed of 850 rpm requiring an IQ of 22 mg/stroke. The 22 mg/stroke
needing a duration of 9 “Cr. This is similar to the map chart above for 800-1000 rpm. 2000 rpm requiring an IQ of 52 mg/stroke which needs a duration of 20 “Cr.
This is similar to the map chart above.
In simple terms, the more fuel needed (IQ) the longer it takes to inject so Duration (“Cn) increases.
There is a physical limit to this increase in duration length so limiting factors for lQ may limit IQ as
engine speed rises but also IQ will be limited by the duration maps. If duration becomes TOO long, it will have to start well before TDC and very early injection is not physically possible or desirable.
From the Duration 1 map we can see that an idle speed of 800 – 1000 rpm is injecting about 7mg/stroke with a duration of about 7 “Cr and we can see that increased IQ requires increased
duration and this increases the engine speed rpm. So as engine speed rises, IQ occurs earlier and earlier because the duration will need to be longer and longer.
8.Start Of Injection(SOI)
As we have seen, increased duration requires an increase in the SOI time. In other words, if you
have more duration you start injection earlier, This might seem like you are advancing SOI but this is not what engineers normally mean by advancing SOI.
Idle might require an IQ of 7mg/stroke, a duration of 7″Cr and a start point of 7” BTDC while 2000 rpm might require an IQ of 52 mg/stroke a duration of 20 “Cr and a start point of 20 ” BTDC but this is a SOI advancement due to increased duration. lt is not what engineers usually mean when they refer to advancing the SOI.
Advancing SOl is a way of increasing power from the engine and typically the SOI is advanced as the engine speed (rpm) increases. Advancing the SOI is physically limited by the camshaft and injector designs. True SOI advance is usually in the region of 3% to 10%, so not very much. Too much advance of SOI can also damage the engine and this is taken into account with the SOI maps.
There are 10 SOI maps numbered 0 – 9. These are selected by a SOI selector map which is temperature based. Map 9 being the map that a warmed up engine would be running on.
Sol 9 This is raw hexdump data.
Rows are Engine speed. 100 – 5000 rpm. Columns are lQ.0 – 60 mg/stroke.
Table data is Crankshaft angle degrees. (°Cr)
As raw data for crankshaft angle is impossible to interpret | have included a chart with factors added.
If you look at a typical idle speed of 800 – 1000 rpm and a likely IQ of 5 – 10 mg/stroke you can see that SOI will be 0°Cr BTDC.
If we assume a maximum IQ of 45 mg/stroke after all limiters have taken effect;
1750 rpm requires an SOI of 12 °Cr
2000 rpm requires an SOI of 12 °Cr
2250 rpm requires an SOI of 14 °Cr
2500 rpm requires an SOI of 16 °Cr.
2750 rpm requires an SOI of 18°Cr
3000 rpm requires an SOI of 20 °Cr
3250 rpm requires an SOI of 22 °Cr
3500 rpm requires an SOI of 24 °Cr
4000 rpm requires an SOI of 27 °Cr
4500 rpm requires an SOI of 28 °Cr
5000 rpm requires an SOI of 28 °Cr
So the Start Of Injection point is steadily advancing. This is partly due to the fact that Duration has got longer. (More IQ needs more Duration) and partly due to the fact that ignition is being
ADVANCED by the ECU to give more power.
Many people struggle to understand Duration and SOI maps. Look at a comparison between VAG pd 130 bhp maps and pd 150 bhp maps and you will see that very little changes. Changes involved must be small and calculated carefully.
Poorly calibrated Duration and SOI maps will make engine performance worse not better and may cause serious damage to the engine.
Other maps.
10.EGR
This is raw hexdump data.
Rows are Engine speed. 100 – 3612 rpm.
Columns are IlQ. 0 – 51 mg/stroke.
Table data is MAF. 0 – 850 mg/stroke.
The map below id usually described as an EGR or Exhaust Gas Recirculation map. In reality, only a part of the map is for exhaust gas recirculation. The map really represents expected MAF values when the EGR valve is working.
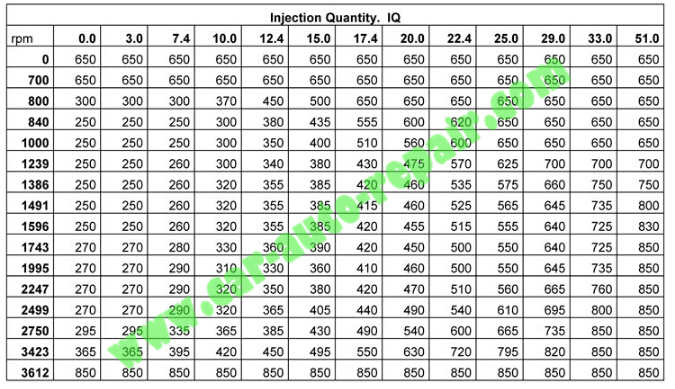
At 3612 rpm and above the EGR does not function and the maximum MAF value of 850 mg/stroke appears for all lQ values.
The difference between 850 and the values in the chart are the EGR values.
So 3612 rpm at 51 mg IQ has an EGR value of 850 (expected) – 850 (chart) = 0 (zero). and 1995 rpm at 20.0 mg IQ has an EGR value of 850 – 500 =350.
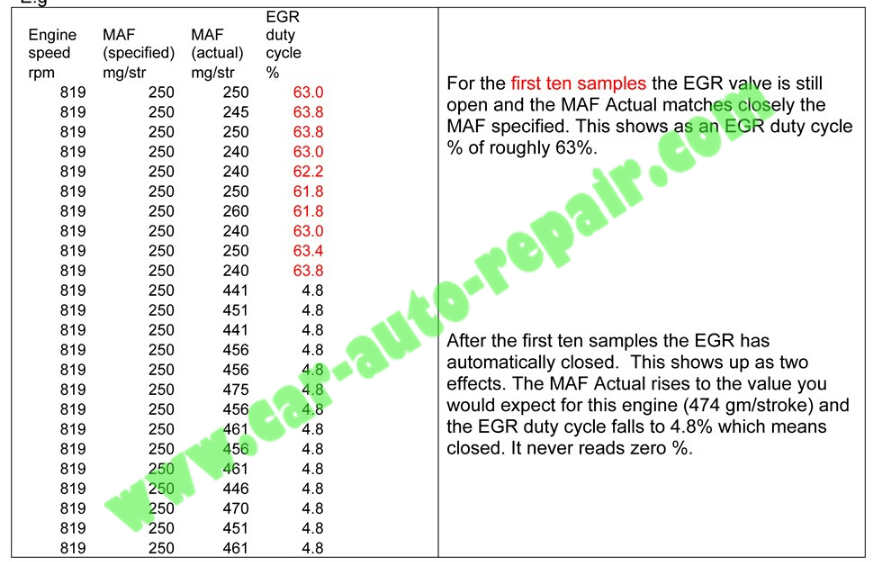
The rpm rows of 800 – 1000 rpm do not represent ‘idle’ even though they are in the idle speed range. At true idle the ECU will revert to the idle map and the EGR will close. This can cause confusion when looking at live VCDS data.
The EGR is most useful at cruising speed without acceleration .
20 mg/stroke IQ at 2247 rpm gives a MAF value of 470 mg/stroke. If the total available MAF is 850 mg/stroke and the MAF sensor is only reading 470 mg/stroke, 380 mg/stroke must be flowing through the EGR valve as recycled exhaust gas.